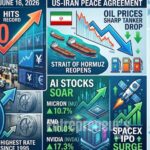
NEW YORK, June 16, 2026: Diplomatic breakthroughs rarely move markets this fast. The gold price after Iran peace deal announcement on June 14, 2026 said everything: up 3.6% in a single session. Silver exploded. Oil cratered. And a Federal Reserve that had spent the entire spring being methodically hawkish suddenly found itself staring at a macro environment that had shifted beneath its feet in under 48 hours. This is not a one day story.
- Gold Price After Iran Peace Deal: What the Agreement Actually Says
- Gold: Why Peace Sent a Safe Haven Metal Higher
- Silver: A Bigger Move, a More Specific Signal
- Oil: The Engine Behind the Entire Story
- The Federal Reserve: Constrained, Not Free
- The Four Scenarios Investors Need to Hold in Their Heads
- The Analytical Takeaway: What Separates Smart Positioning From Noise
- Frequently Asked Questions
It is the macro story U.S. investors have been waiting on since late February, when the outbreak of the Iran War put the Strait of Hormuz a 33 kilometer wide waterway that carries roughly 20% of the world’s daily oil consumption on a collision course with the global supply chain. What happens over the next 60 days of diplomatic negotiations will determine whether June 15 was a genuine turning point or the most expensive relief rally of the year.
Gold Price After Iran Peace Deal: What the Agreement Actually Says
On June 14, the U.S. and Iran announced an interim agreement set to take effect Friday, June 20. According to CNN, President Donald Trump confirmed that the U.S. is lifting its naval blockade on Iranian ports and that the Strait of Hormuz will reopen upon signing. Trump added on Monday that ships “many loaded up with oil” are already moving through the strait.
British Prime Minister Keir Starmer, per CNN, called it “a hugely important step forward in ending the war, ensuring regional stability and re-opening the Strait of Hormuz.” The UK and France announced they stand ready to support the technical talks that will now begin.
The Hormuz reopening impact on markets was instant oil fell, gold jumped, and the dollar weakened before diplomats had finished their statements. Understanding the gold price after the Iran peace deal requires reading what the agreement actually does. The naval blockade lifts. The Strait reopens. Oil that has been locked out of global markets for more than three months begins moving again.
Resuming that supply reduces the inflation pressure that had been pushing the Federal Reserve toward rate hikes all spring. Lower rate expectations weaken the dollar. A weaker dollar lifts gold. Every clause in this agreement that brings oil back online is, indirectly, a clause that moves the gold price. What the deal does not resolve is equally important.
Iran’s nuclear program remains entirely unaddressed. Iran’s deputy foreign minister has stated that substantive negotiations will only begin when the U.S. releases billions in frozen Iranian funds a condition that an American official has publicly rejected, per NPR. Mine clearing operations, confirmed by Trump himself, are expected to take additional weeks to complete.
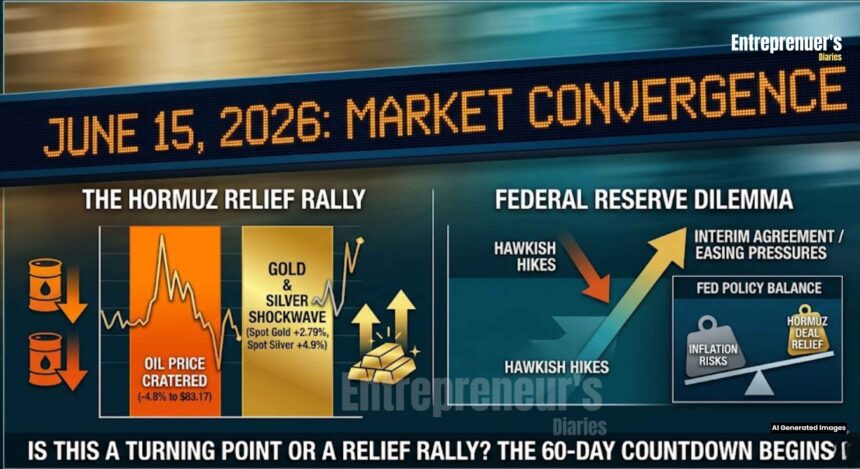
Iran peace deal oil prices will not snap back overnight. Tamas Varga of PVM Oil Associates was direct: “It will take time for oil to approach the pre-crisis level.” This is a framework, not a resolution. Gold and silver prices after Hormuz deal surged on that distinction but the fine print tells a more complicated story.
Gold: Why Peace Sent a Safe Haven Metal Higher
Most commentators got gold’s reaction wrong in their first takes. This was not a safe haven trade. It was a rate expectations trade. Spot gold jumped as much as 3.6% to nearly $4,370 an ounce on June 15 before settling around $4,336.20, up 2.79%, per Kitco data. That seems paradoxical a peace deal reducing geopolitical risk should, in theory, reduce demand for safe haven assets. And yet gold surged. The answer lies in what the Iran War had done to the Federal Reserve’s policy path.
When the Strait closed in late February, oil surged past $100 a barrel, threatening to push U.S. headline inflation to levels that would have compelled aggressive rate hikes. Rising rate expectations compress gold’s appeal because gold pays no yield. The war was generating the wrong kind of uncertainty for bullion.
The Hormuz deal flips that entire mechanism. Lower oil reduces inflation pressure. Less inflation pressure reduces the probability of Fed rate hikes. A less hawkish Fed weakens the dollar. A weaker dollar is structurally bullish for dollar denominated commodities, gold prominently among them.
Christopher Wong, FX strategist at Oversea Chinese Banking Corp., had previously noted that for gold to build genuine momentum, the external environment needs “a convergence of softer yields, lower oil prices, and clear evidence that the Federal Reserve’s hawkish repricing cycle has reached its ceiling.” The Hormuz deal made that convergence plausible for the first time since February.

Brett Elliott, director of marketing at APMEX, had forecast a June 2026 trading range of $4,300–$4,725 “unless a major catalyst occurs.” That catalyst has now arrived. Gold crossed $5,000 in January 2026 before pulling back sharply. At $4,336, the technical setup for patient investors remains constructive but the 10 year Treasury yield slipped only modestly to 4.47%, and market consensus still leans toward at least one more Fed hike in 2026. That overhang keeps a ceiling on gold until inflation data meaningfully softens.
Silver: A Bigger Move, a More Specific Signal
If gold’s rally captured the headlines, silver’s 4.9% surge told the deeper story. Spot silver climbed to $70.67 per ounce on June 15, per Kitco, outpacing gold’s percentage gain by a significant margin. Silver’s dual identity part monetary metal, part industrial commodity made that amplified response entirely logical.
The history matters. When the Hormuz crisis hit in March 2026, silver plunged 8.2% in a single session in what markets called the “Hormuz Shock,” dragging the metal to near $70.90. Since the war began February 28, silver had already declined nearly 20% from its January peak above $100 per ounce having briefly touched $116 in the weeks just before the conflict. The April ceasefire pushed silver briefly above $76.70 before durability concerns dragged it back down through May.
A de-escalation environment simultaneously reduces safe haven demand for the dollar and improves the industrial activity outlook, compressing two separate bearish pressures on silver at once. That dual sensitivity explains why silver consistently outperforms gold on a percentage basis in genuine de-escalation scenarios.
For investors with exposure to manufacturing, clean energy, or semiconductor fabrication, the directional signal is clear: the market is transitioning from crisis pricing to normalization pricing. How fast that transition goes depends entirely on whether the diplomatic framework survives the next 60 days.
Oil: The Engine Behind the Entire Story
Brent crude fell 4.8% to $83.17 a barrel on June 15 back near early March levels. U.S. crude traded below $80. These moves are not incidental to the gold and silver story. They are the gold and silver story.
The Federal Reserve Bank of Dallas quantified the damage precisely. In research published in April, Dallas Fed economists found that a 15% global oil supply shortfall consistent with the Strait’s closure raised annualized U.S. headline inflation by 1.7 percentage points in Q1 2026, with elevated headline inflation persisting through Q3. Core inflation rose by 0.4 percentage points in Q2 alone.
Goldman Sachs, which raised its 12-month U.S. recession probability from 20% to 30% after the war’s outbreak, estimates that a sustained 10% rise in oil prices raises headline PCE inflation by approximately 0.2 percentage points while shaving 0.1 points off GDP growth. Goldman had projected PCE inflation ending 2026 around 2.9% well above the Fed’s 2% target with the Hormuz timeline as the single largest variable in that forecast.
Every dollar that Brent crude falls below its wartime peak removes inflationary pressure from household energy bills, transportation costs, and goods prices across the economy. For a U.S. consumer already showing fatigue in discretionary spending per Commerce Department data reported by The Wall Street Journal in May that relief could materially change the second half economic trajectory.
The Federal Reserve: Constrained, Not Free
No institution was more constrained by the Hormuz crisis than the Federal Reserve. Heading into its June 16–17 FOMC meeting, the central bank faced an almost impossible position: inflation still running above 3% on headline PCE, oil amplifying that pressure, and a darkening growth outlook simultaneously. Raising rates risked pushing a slowing economy into recession. Cutting them risked accelerating an inflation problem that had not been solved even before the war.
Fed Governor Christopher Waller acknowledged the bind openly, stating that while a reopened Strait “could pave the way to rate cuts later this year,” there is no guarantee given “the possibility that this series of price shocks may lead to a more lasting increase in inflation.” Fed Vice Chair John Williams had stated that “even based on what we’ve seen already, inflation will be well above 3% over the next few months.”

Treasury yields eased the 10-year slipping to 4.47% and per Reuters, traders are now pulling back on bets for a U.S. rate hike this year. The dollar traded near a 10-day low. These are meaningful signals. They are not the same as clarity. A single hostile move in the Strait, or a breakdown in the frozen funds dispute, could reverse every one of Monday’s commodity and currency moves before the end of the month.
The Four Scenarios Investors Need to Hold in Their Heads
The market is a probability weighted distribution across four plausible outcomes right now. Positioning without understanding all four is how portfolios get caught on the wrong side of a 48-hour reversal.
Scenario One — Deal holds, mine clearing completes, oil normalizes below $85. Gold trades $4,300–$4,600 through Q3. Silver tests $80. The Fed signals a possible December cut. Risk assets broadly outperform. This is the base case the market began pricing on June 15.
Scenario Two — Deal holds but implementation stalls. The frozen funds dispute delays substantive talks. Mine clearing takes longer than announced. Oil stays volatile in an $80–$95 band. Gold holds above $4,200 but builds no real momentum. The Fed stays on hold indefinitely. The second half of 2026 looks like the first: uncertain and incrementally more difficult.
Scenario Three — Deal collapses, hostilities resume. Oil re-tests $100 or higher. Gold returns to its safe haven bid above $4,500. Silver re-tests its lows. The Fed faces a textbook stagflation scenario. Goldman’s 30% recession probability rises sharply. This is the tail risk institutional options desks are still buying protection against, even after Monday’s rally.
Scenario Four — Full diplomatic normalization over the 60-day window. Iran’s nuclear program enters serious negotiation. Oil normalizes durably. Gold tests $4,700 and higher. Silver re-approaches $90. This is the best case for Fed rate cuts in 2026. It is also the least certain by a wide margin.
Most institutional positioning sits between Scenarios One and Two, with real money hedged against Scenario Three. Scenario Four is in no one’s base case yet.
The Analytical Takeaway: What Separates Smart Positioning From Noise
The trade that June 15 set up long precious metals, short oil volatility, cautiously long risk assets is internally consistent if the framework holds. Lower oil is disinflationary. Disinflation reduces rate hike pressure. Lower rate hike pressure weakens the dollar. A weaker dollar is tailwind for dollar denominated commodities. That logic chain is sound. But “directionally correct if the framework holds” is not the same as “a trade to size aggressively today.”
The Strait has been closed for more than three months. The Federal Reserve Bank of Dallas data shows the oil shock added 1.7 percentage points to annualized U.S. headline inflation in Q1 2026. That does not reverse in one FOMC meeting. Goldman Sachs still has PCE inflation ending 2026 at 2.9%. The Fed’s 2% target is not close. What June 15 gave investors was optionality, not certainty.
Gold at $4,336, below its January peak of more than $5,000, offers a reasonable entry for investors who believe disinflation follows. Silver at $70.67, well below its January peak above $100, offers more upside leverage on the same thesis with proportionally more downside if Scenario Three materializes.
The single most important number to watch over the next 30 days is not the gold price or the silver price. It is Brent crude. If crude normalizes sustainably below $85 and holds there through July, the disinflation trade in precious metals will gather real institutional momentum.
If crude bounces back above $90 on any breakdown in the Strait reopening, Monday morning’s gains unwind fast. Position sized for the former. Hedged for the latter. The war may be winding down. The uncertainty is not over. It has just changed shape.
Frequently Asked Questions
Why did gold prices rise when a peace deal was announced? Shouldn’t peace be bad for gold?
This is the question most retail investors got wrong on June 15. The gold rally was not a safe haven move it was a rate expectations move. The Iran War had driven oil above $100 per barrel, raising U.S. inflation expectations and increasing the probability of Federal Reserve rate hikes.
Higher rate expectations are bearish for gold because gold pays no yield and becomes less attractive when interest bearing assets offer better returns. The Hormuz deal reversed that logic: lower oil reduces inflation pressure, which reduces the likelihood of rate hikes, which weakens the dollar, which is bullish for gold. The peace deal was good for gold precisely because it was disinflationary, not because it increased geopolitical fear.
What is the Strait of Hormuz and why does it matter so much for the U.S. economy?
The Strait of Hormuz is a 33-kilometer wide maritime chokepoint between Iran and Oman that connects the Persian Gulf to the broader global oil market. It carries approximately 20% of the world’s daily oil consumption and 20% of global LNG flows.
When it closed in late February 2026 following the outbreak of the U.S. Iran conflict, the Federal Reserve Bank of Dallas estimated that the resulting 15% global oil supply shortfall raised annualized U.S. headline inflation by 1.7 percentage points. For the U.S. economy, a closed Hormuz means higher gasoline prices, higher transportation costs, higher goods prices, and more pressure on the Federal Reserve to raise interest rates rather than cut them.
Is now a good time to buy gold or silver given the Hormuz deal?
This is not financial advice, and professional investors should consult their own advisors. What the verified market data shows: gold is trading near $4,336 per ounce, significantly below its January 2026 peak above $5,000. Silver at $70.67 is well below its January 2026 peak above $100 per ounce. The direction of travel lower oil, less Fed hawkishness, weaker dollar is constructive for both metals.
The risk is that the Hormuz deal breaks down, oil spikes again, Fed rate hike expectations return, and both metals sell off. Investors weighing entry should size positions to survive a deal collapse while remaining positioned to benefit from full normalization.
How does the Hormuz deal affect U.S. interest rates and the Federal Reserve’s plans?
The Federal Reserve was effectively paralyzed by the Hormuz crisis heading into its June 16–17 FOMC meeting. With headline PCE inflation still running above 3% and oil amplifying that number, cutting rates was mathematically difficult. The Hormuz deal, by pulling Brent crude back below $84, removes the oil driven inflation premium from Fed calculations.
Fed Governor Christopher Waller has acknowledged that a reopened Strait “could pave the way to rate cuts later this year.” Per Reuters, traders were already pulling back on bets for a U.S. rate hike in 2026 as of June 15. The Fed’s June 17 decision and forward guidance will be the clearest signal yet of how the central bank intends to treat this diplomatic development.
What happened to silver prices during the Iran War, and where does it go from here?
Silver had one of the most volatile performances of any major asset class during the conflict. It touched $116 per ounce in early 2026, then plunged nearly 20% after the Hormuz closure began in late February, including an 8.2% single session crash in March known as the “Hormuz Shock.” The April ceasefire pushed it briefly above $76.70 before concerns about deal durability dragged it back down.
On June 15, silver surged 4.9% to $70.67. Silver’s dual sensitivity as both a monetary metal and an industrial commodity means it tends to outperform gold on a percentage basis in genuine de-escalation scenarios. If the Hormuz deal holds and global industrial demand recovers, silver has more upside room than gold relative to its recent trading range.
What does the Hormuz deal mean for U.S. consumers?
The most direct effect is at the gasoline pump. With Brent crude falling 4.8% to $83.17 on June 15, the oil driven surge in energy costs that has pressured household budgets since late February is beginning to ease. Goldman Sachs estimates that a sustained 10% drop in oil prices reduces headline PCE inflation by approximately 0.4 percentage points.
For a U.S. consumer already showing fatigue in discretionary spending categories per Commerce Department retail sales data reported by The Wall Street Journal in May this is meaningful relief. If the deal holds and oil continues normalizing, the second half of 2026 could see a genuine improvement in real consumer purchasing power for the first time since the war began.
What is the biggest risk to this gold and silver rally?
The single largest risk is deal collapse. The framework agreement leaves Iran’s nuclear program unresolved, and Iran’s deputy foreign minister has conditioned substantive follow on talks on the release of billions in frozen Iranian funds a condition an American official has publicly rejected, per NPR. Mine clearing in the Strait could take weeks.
Any resumption of hostilities would immediately reverse Monday’s commodity moves: oil would spike, inflation expectations would return, the dollar would strengthen, and both gold and silver would face renewed selling pressure. Per Reuters, institutional options desks were still buying put protection on commodity positions even after Monday’s relief rally a sign that professional money is not treating the deal as a done deal.
Connect With Us On Social Media [ Facebook | Instagram | Twitter | LinkedIn ] To Get Real-Time Updates On The Market. Entrepreneurs’ Diaries Is Now Available On Telegram. Join Our Telegram Channel To Get Instant Updates.

Isabella is a global business journalist and former McKinsey analyst from Brazil. She brings sharp insights on economic shifts, policies, and founder journeys from around the world.

Tokyo-based CFA translating global markets into clear insights for modern entrepreneurs.